
The latest research from Descartes Datamyne, based on U.S. bill-of-lading (BoL) import data, pins down the impact of tariffs and trade restrictions.
BoL import data is a granular, shipment-level dataset that is compiled from the official shipping manifests submitted to U.S. Customs and Border Protection (CBP).
The report’s authors said that after “Liberation Day” of April 2, 2025, when the U.S. introduced reciprocal trade tariffs, the country’s trade landscape underwent significant changes over the subsequent 12 months to May 1, 2026 (the data does not include the impact of tariffs that were imposed after that date).
The researchers found that import activity in the country dropped by 4.5 percent in total compared with the prior 12 months and, as a result, contributed to the country’s declining trade deficit.
Import growth halted and then fell after IEEPA trade restrictions were introduced in late August 2025 but then soared by 9 percent in the year in April 2026, following the sudden reversal of such measures by the Supreme Court.
“Keep in mind: The IEEPA tariffs were not the only government policy reshaping trade over this period,” the report’s authors said. “The tariffs were positioned as an incentive to negotiate new trade deals (and lower rates), as, for instance, Vietnam did. Other tariffs were imposed during this time, including Section 232 tariffs on aluminum and steel. As soon as the IEEPA tariffs ended, 122 tariffs took their place.”
The report noted that tariffs painted much of the globe in shades of red and green as new market share and trade relationships emerged in the wake of increasingly broad-based tariffs imposed by the U.S.
The report found that within the region, Mexico solidified its position as the largest supplier to the U.S., climbing 6.6 percent over last year, as Canada fell 10.6 percent. Even as U.S.-China trade collapsed, emerging trade relationships between Asian nations and alternative markets for their exports drove dramatic growth among secondary manufacturing hubs in the region.
Among them, Vietnam surged 16 percent by volume, Thailand soared 24 percent, and Indonesia, catapulted into the top ten suppliers to the U.S. by maritime trade volume, leapt a massive 73 percent.
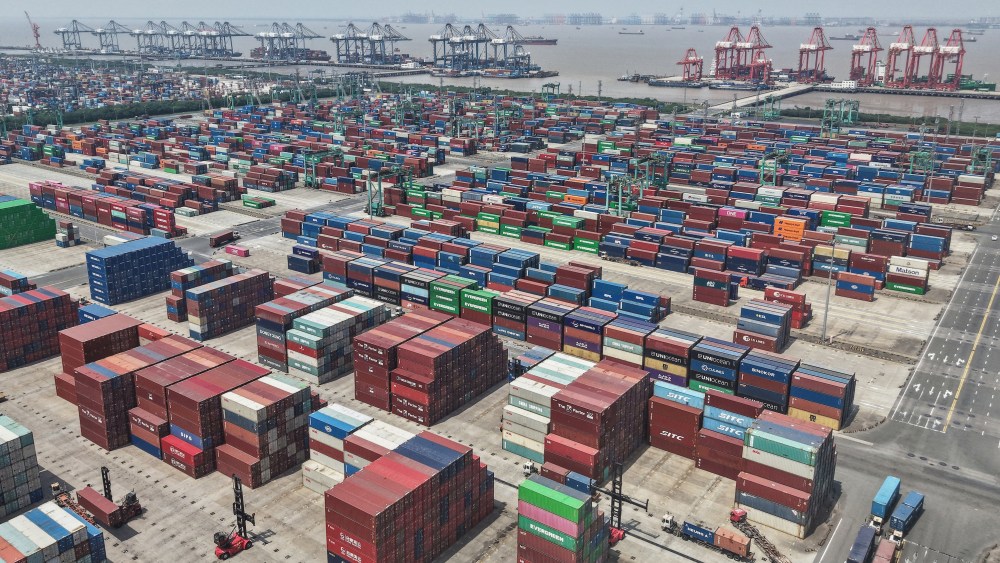
The trade realignment affected ocean-going shipping to the U.S. further. Measured in container volume, the researchers noted that total import shipping declined 4.3 percent during the reporting period. While China, the leading country in maritime trade to the U.S., remained at the top of the list even as its overall shipping volume decreased 18 percent during the period, its secondary Asian competitors all increased their share of maritime trade to the U.S. Notably, Vietnam reported a 16 percent gain in shipping volume during the reporting period, Thailand’s shipping volume surged by 24 percent and Indonesia leapt into the top ten U.S. maritime trade sources.