
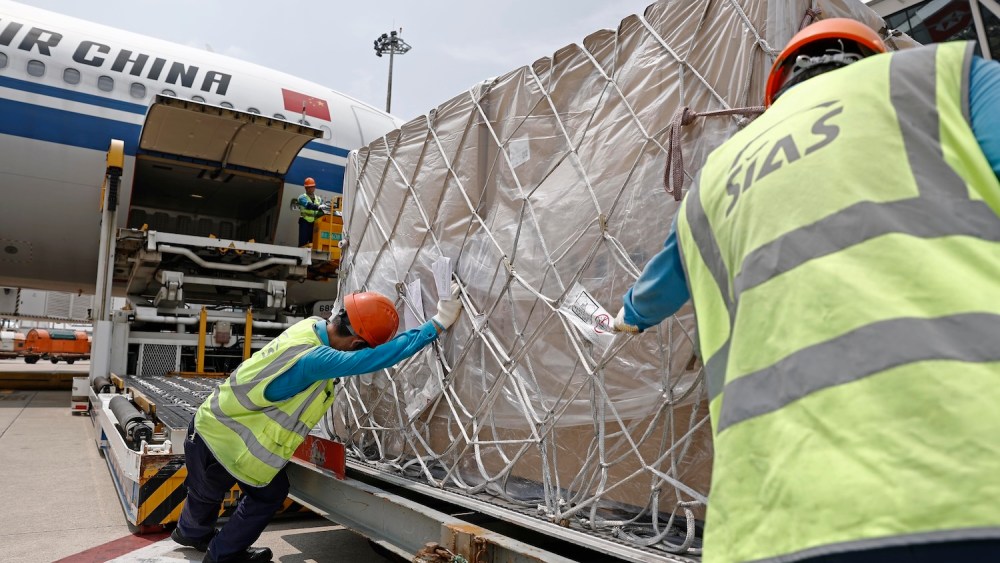
Trans-Pacific air cargo demand is seeing more strength as the trade lane continues its 2026 rebound.
Asia-to-North America air cargo demand again outperformed the broader market in July, with cargo tonne-kilometers (CTKs) up 9.2 percent and the trade lane posting its sixth consecutive month of growth, according to data from the International Air Transport Association (IATA).
In its monthly report, IATA indicated that the strength in air from Asia to North America was consistent with tariff-related front-loading seen throughout the summer, as well as other factors impacting ocean freight including elevated trans-Pacific container rates and constraints at several Chinese hubs.
The month represented further normalization of the trade route, which was impacted significantly last year after the Trump administration levied country-specific tariffs on global trade partners and scrapped the duty-free de minimis provision for goods exiting China. Last July, air cargo demand from Asia to North America declined 1 percent year over year.
Total demand across all markets increased by 3.9 percent compared to last July, with cross-border cargo demand jumping 4.7 percent.
“While all regions recorded growth, airlines in Asia-Pacific, Europe and North America accounted for more than 90 percent of the overall increase,” said Marie Owens Thomsen, IATA’s senior vice president of sustainability and chief economist, in a statement.
North American carriers led with a 7.1 percent increase, followed by gains of 5.2 percent for Asia Pacific and 4.6 percent for Europe, IATA said.
Across the board, growth has eased from stronger rates recorded earlier in the year, pointing to sustained expansion with less momentum. For example, air cargo demand had increased 6 percent in May, before jumping 8.5 percent in June.
Overall, there is a sharp shift in how goods are moving by air.
Dedicated freighter traffic expanded 13.9 percent year over year in July, the category’s third-straight month of double-digit growth and strongest increase in more than five years. Belly-hold CTKs fell 7 percent from the year prior, marking its first contraction. The decline partly reflected related disruptions to passenger operations, which reduced available belly-hold capacity.
“Dedicated freighters gained market share as belly-hold traffic declined, possibly reflecting demand for larger or specialist shipments and the operational flexibility that freighters can provide,” said Thomsen.
On the Asia-to-North America corridor, dedicated freighter CTKs rose 12.2 percent, accounting for much of the additional cargo moving between the two regions.
Recent investments by DHL and FedEx reflect the continued growth on the trade lane and the preference for dedicated freighters. DHL is spending $205 million to triple its air cargo capacity at its hub in China’s Shenzhen Airport, while FedEx is investing $400 million to expand its operations across various airports in India.
Capacity growth, meanwhile, has remained relatively restrained. Global available CTKs increased just 1.7 percent in July, compared with the 3.9 percent demand increase, pushing the industrywide cargo load factor up 1 percentage point year over year, IATA said.
The imbalance was even more pronounced among North American carriers, where cargo demand increased 4.8 percent while capacity declined 1.5 percent. The result points to tighter utilization across a market where shippers continue to rely on air freight to move goods quickly amid trade and supply chain uncertainty.
Looking ahead, Thomsen said the industry’s outlook remains “broadly positive,” supported by manufacturing activity, export orders and global trade. However, she said higher fuel prices, the ongoing geopolitical tensions and tariff uncertainty will need to be “watched carefully.”
While jet fuel prices are down nearly 25 percent from their peak in April, when they reached $209 per barrel according to the Jet Fuel Price Monitor from energy information provider S&P Global Platts, they remain largely in line with prices seen throughout late June and July.
According to the index, the average global jet fuel price in the week ending Aug. 28 was $156.85 per barrel, down 4.3 percent from $163.87 per barrel as of the week ending Aug. 21. When compared to four weeks prior, average prices declined 1.9 percent.
On average, jet fuel prices for the week remain 74.2 percent more expensive than the same week in 2026.
The fuel prices play a role in overall air freight spot rates, which have edged up 28 percent year over year to $3.36 per kilogram as of Saturday, according to data from air cargo market intelligence platform WorldACD.
When broken down in individual markets, the biggest annual percentage rises came from North America (51 percent), the Middle East and South Asia (42 percent) and Europe (27 percent), with Asia Pacific origin rates up 22 percent.